After building and releasing PWNboard, I got some great feedback from many folks especially Vyrus (seriously thanks!). Vyrus gave me a little insight into what he and the National CCDC team were prepping which made me realize they were leagues ahead of PWNboard. But it served as pure inspiration.
I started thinking about Red Ream Telemetry (RTT) beyond CCDC, what lengths could one take it to and how could I use telemetry to convey impact and insights on red team engagements. A few ideas came to mind almost immediately, have better insight into red team operations and have a log of all actions taken against a target/organization help the blue team improve their defenses.
I’ve only played around a little with ELK in the past and I wasn’t aware of the power of libbeat until Vyrus pointed it out. Digging into Beats, packetbeat and filebeat looked like immediate winners for red team telemetry. In Part 1 of this series, I’ll dive into getting Elasticsearch and Kibana stood up, packetbeat installed and configured, and some initial dashboards created. And the infrastructure we’ll be adding telemetry to has been outlined in my previous post Hybrid Cobalt Strike Redirectors; secifically Iteration Two - Nginx & OpenVPN.
Also, while I was in the middle of building this, Vincent Yiu posted some great work on doing the same type of telemetry in Splunk: CobaltSplunk
Installation and Configuration
Using the official Elastic installation instructions, getting your ELK stack up and running is very straight forward.
- Install Elasticsearch - https://www.elastic.co/guide/en/elasticsearch/reference/current/_installation.html
- Install Kibana - https://www.elastic.co/guide/en/kibana/current/install.html
- Securing Elasticsearch - https://www.elastic.co/guide/en/x-pack/current/elasticsearch-security.html
The only deviation from the install instructions I found was to modify /etc/elasticsearch/elasticsearch.yml and point the JAVA_HOME variable to my Java install.
Packetbeat
In our Cobalt Strike infrastructure, the redirectors receive all traffic from the beacons, whether it’s DNS or HTTP communication. Packetbeat is a packet analyzer and is perfect for monitoring all of the redirector traffic. Follow the installation instructions to get packetbeat installed.
For our purposes, we’re interested in in DNS and HTTP traffic and will configure packetbeat to fully capture and log those packets. For our setup, I configured packetbeat to only listen on eth0 so we don’t see any cross-talk with the VPN infrastructure.
packetbeat.interfaces.device: eth0
Since we’re enabling full packet captures, I disabled flows as they seemed unnecessary.
packetbeat.flows:
  enabled: false
Configure the ports for your HTTP communications:
- type: http
  # Configure the ports where to listen for HTTP traffic. You can disable
  # the HTTP protocol by commenting out the list of ports.
  ports: [80]
In order to capture the HTTP bodies, we have to configure the associated MIME types in include_body_for. This will be specific to the Cobalt Strike Malleable C2 profile you use.
include_body_for = ["text/plain", "text/xml"]
Configure the Kibana server address:
setup.kibana:
  host: "192.168.99.5:5601"
Configure the elasticsearch server address:
output.elasticsearch:
  # Array of hosts to connect to.
  hosts: ["192.168.99.5:9200"]
Restart the packetbeat the packetbeat service:
service packetbeat restarting
If all goes well, you should now have data flowing from the redirectors to the elasticsearch server which you can easily view in Kibana.
Creating Initial Kibana Dashboards
Now that we’ve got the data, we can query and visualize it. If you haven’t worked in Kibana before, the workflow is generally:
- Create and save a query
- Create and save a visualization
- Create a dashboard and add visualizations
I’ll walk through creating a couple of visualizations to demonstrate the usefulness of the data we’re now capturing.
DNS Beaconing
First we’ll work on visualizing our Cobalt Strike DNS beacons. Cobalt strike domain names like 12345.foo.example.com to beacon over DNS. We can query for this using something like: type:dns AND dns.question.name:/[0-9]+.foo.example.com/ Once you zero in on a query you like, save it.
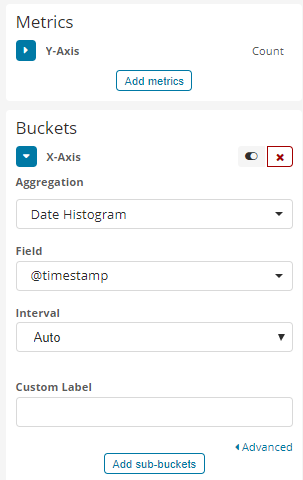
Using the saved query, we can create graph of incoming beacons using a Vertical Bar. In the Visualize tab,
- Click the + icon for a new visualization
- Click on Vertical Bar
- Select your saved search
- Add
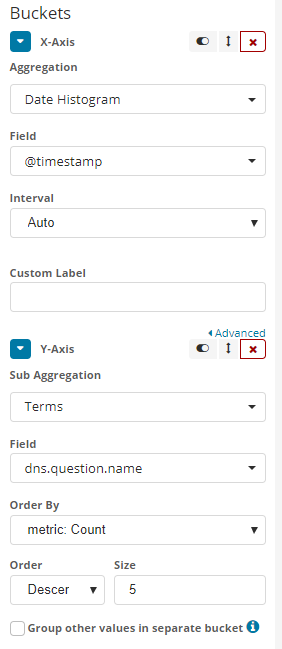
X-Axisas aDate Histogramusing the@timestampfield and anautoInterval
Which results in a visualization like this:
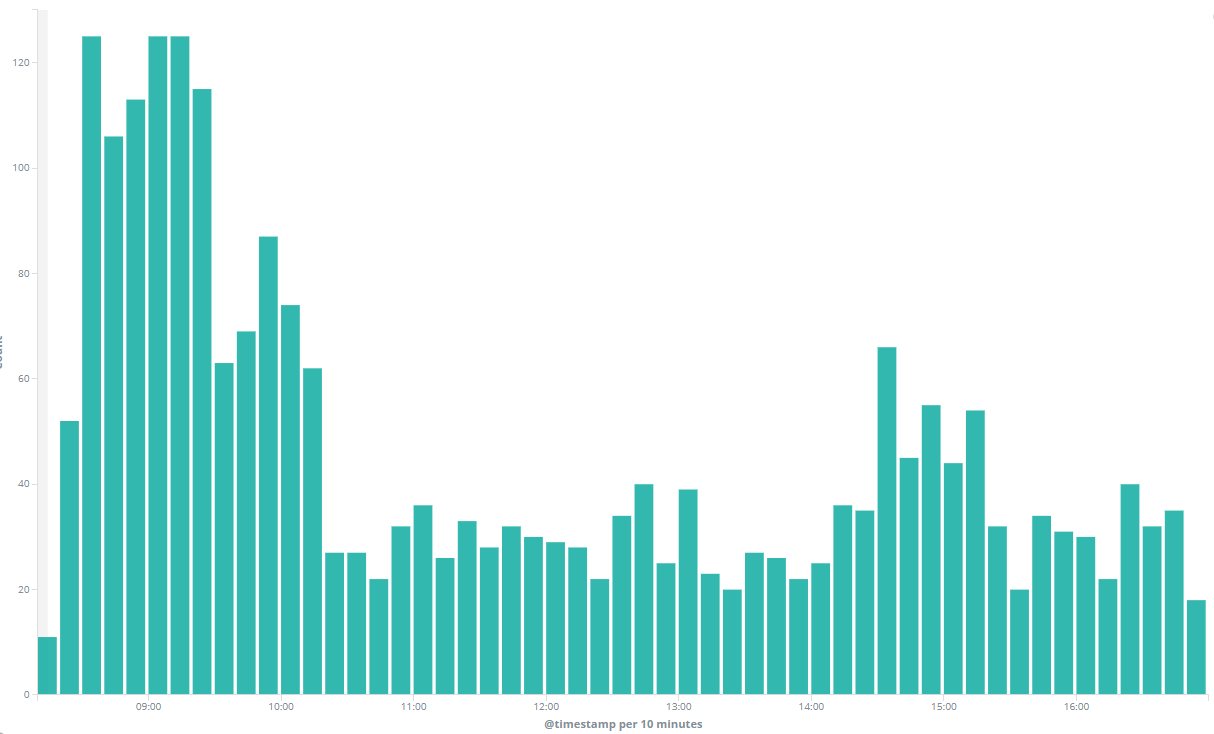
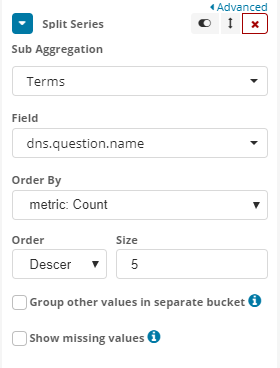
That bar chart will show you the aggregate of all incoming DNS beacons. But you can get even more detailed by adding an additional dimension by creating a stacked bar chart:
- Click
Add sub-buckets - Click
Split Series - Select
Termsfor theSub Aggregation - Set
Fieldtodns.question.name
And your chart should now look something like this:
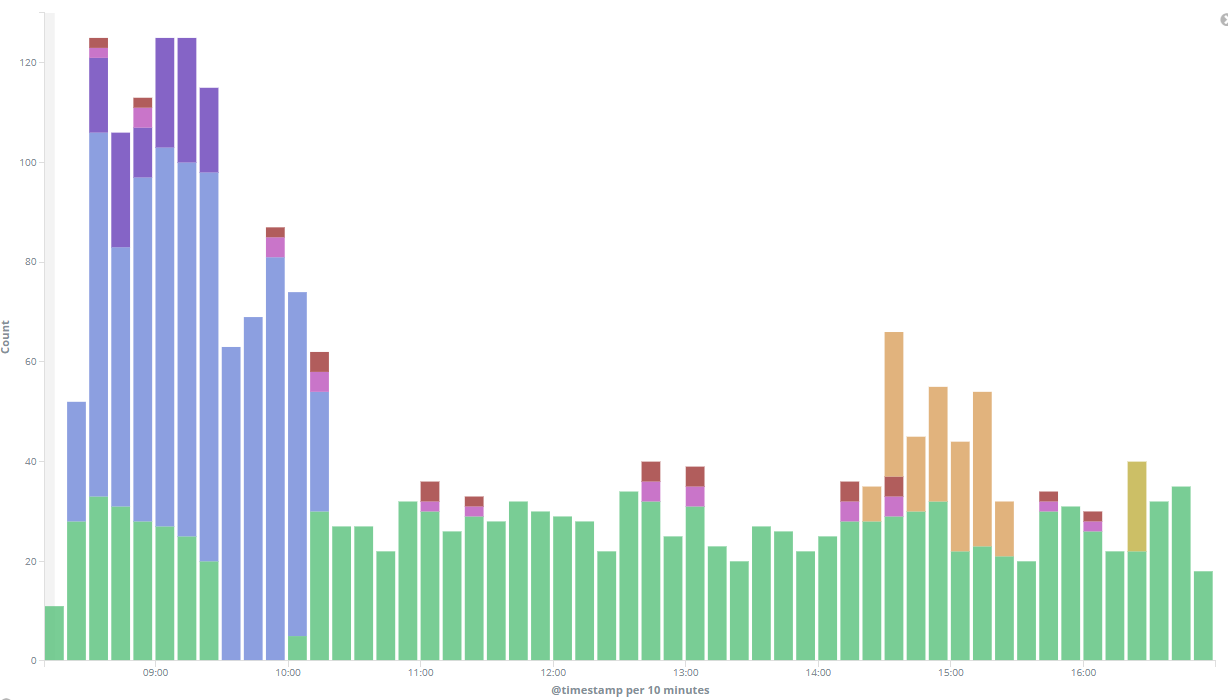
Finally, click Save at the top of the page to save and name your visualization.
Beacon Heatmap
My personal favorite visualization thus far is the Beacon Heatmap. It’s a very similar visualization to what I built for PWNboard. This heatmap will allow us to know what beacons are communicating and at what times and frequencies. This is a powerful tool to understand if and when we may have lost a beacon and what the working hours might be for a compromised endpoint.
- Click the + icon for a new visualization
- Click on
Heatmap - Select the same search we used for the bar graph
- Click
X-Axis, selectDate Histogramand setFieldto@timestampwith anautoInterval - Click
Add sub-bucketsand clickY-Axis - Select
Termsas yourSub aggregationanddns.question.nameas yourField
And if all goes well, you should end up with a visualization like this:
Create The Dashboard
This is the easiest step. Simply create a new dashboard and add your visualizations! Now enjoy the slick new dashboard to monitor your beacons!
Initial Results
Thus far we’ve found having all red team data at our fingertips has been invaluable. Within the first day of our team having RTT, we were able to track down some phantom DNS beacons. Our investigation identified a security vendor monitoring an “IOC” by resolving our C2 domain on a set interval. What surprised us the most was that we don’t use the identified security vendor, which points to one of our other vendors sharing their intel/IOCs.
You also might have noticed that we didn’t do anything Cobalt Strike specific other than looking for beacon patterns. This concept can be applied to other red team and pen testing tools. Later in the blog series we’ll dive into instrumenting a Kali system and potentially other tools like Empire and Pupy.